Q1 2025 Marketing Report


Mailchimp logo featuring a smiling monkey wearing a hat, with the word 'mailchimp' in lowercase letters beneath.

The chamber sends out a weekly email called the Monday Insider, a monthly Newsletter, and a targeted email as needed.

Total Subscribers EOY 2024: 649

We gained 45 subscribers in the first quarter.

Squarespace logo and name

Revenue YTD: $5,700 (↑ 48%)

Traffic YTD:

  • Unique Visits 4.1K (↑ 24%)

  • Total Visits 4.9K (↑ 26%)

  • Page Views 9.5K (↑ 24%)

  • Time on Page 68s

Map of the United States with circular markers indicating data points across various states, varying in size and density.

Geography in Ranking Order (Pennsylvania)

  1. Greenville

  2. Pittsburgh

  3. Hermitage

  4. Meadville

  5. Hadley

  6. Mercer

  7. Cranberry Township

  8. New Castle

  9. Others

  10. Sharon

  11. Grove City

  12. Erie

  13. Linesville

  14. Conneaut Lake

  15. Corry

  16. Red Lion

  17. Farrell

Top Device by Visits

Top Sources by Visits

Top Pageviews

Form & Button Conversions:

  • Top Form Submission - Newsletter Sign Up

  • YTD Buttons Clicked 548 (↓ 20%)

  • YTD Forms Submitted 182 (↑ 237%)

LinkedIn logo with the word 'LinkedIn' in blue text and the LinkedIn icon in a blue square.

2024 Organic Impressions: 3,117 (↑ 39%)

Total Followers: 446
New Followers in the last 30 days: 1

Top Demographics

Location:

  1. Youngstown-Warren

  2. Erie - Meadville

  3. Greater Pittsburgh Region

Industry:

  1. Higher Education

  2. Newspaper Publishing

  3. Others

Job Function:

  1. Media and Communications

  2. Education

  3. Other

Facebook logo in blue font on a white background

Q1 2025

Reach: 27.8 K(↓ 52%)
Content Interactions: 2.1K (↓ 54%)
Followers: 2.8 K

Bar chart showing the percentages of top cities in Pennsylvania, with Greenville at 37.9%, Hermitage at 4.6%, Transfer at 4.4%, Jamestown at 2.6%, Sharon at 2.3%, Hadley at 1.8%, Sharpsville at 1.6%, and Mercer at 1.4%.
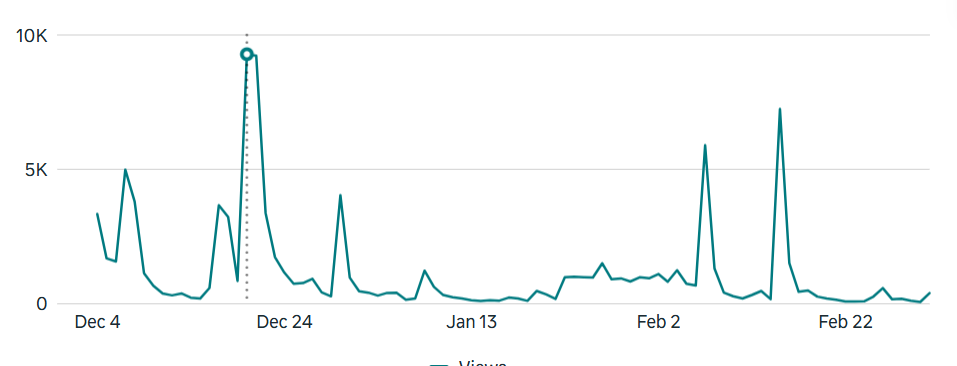
Line graph showing website views from December to February with peaks around December 24th and February 20th.
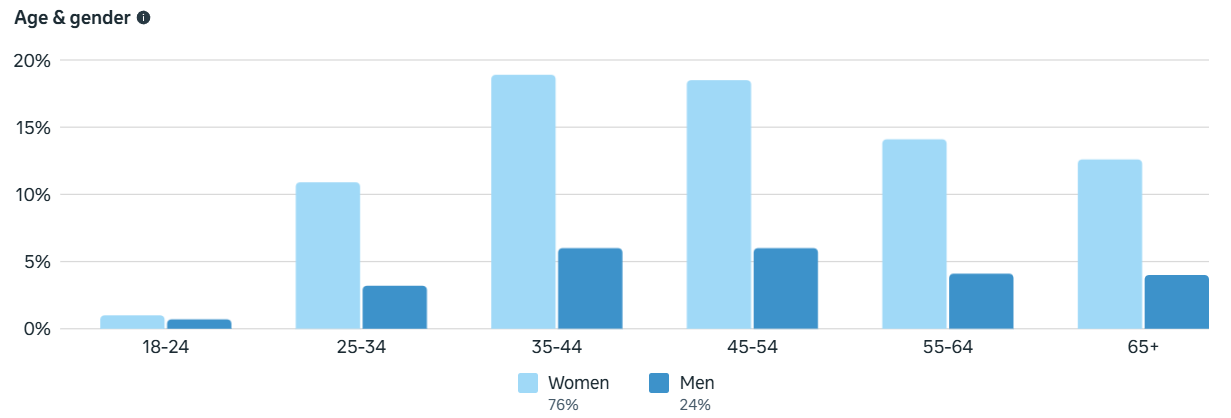
Bar chart showing age and gender distribution, with women in light blue and men in dark blue, across age groups 18-24, 25-34, 35-44, 45-54, 55-64, and 65+.

Top Content:

A screenshot of a Facebook page displaying various posts from the Greenville Area Chamber of Commerce, PA, about local events, nominations, contests, venues, and business congratulations.